About Data Visualization
coScene provides an efficient data visualization interface that presents machine data as visualized data through different "panels" and "layouts," thereby addressing various common machine issues.
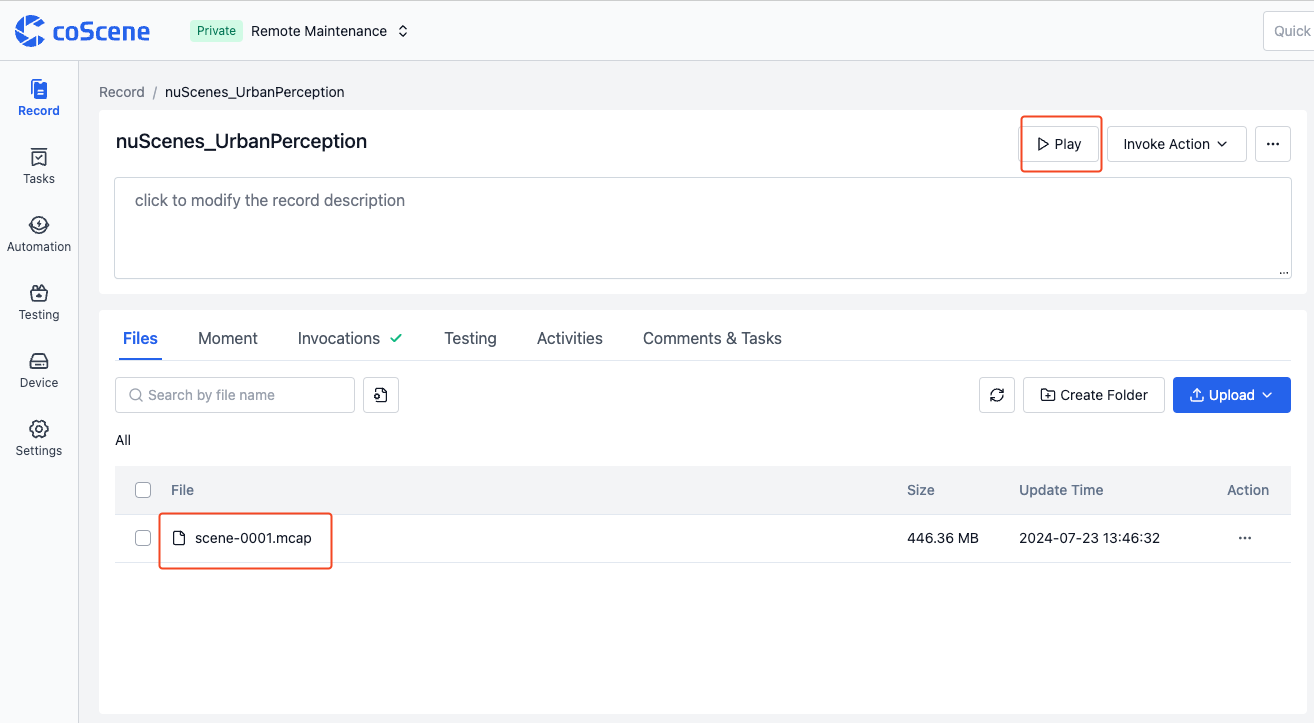
How to Enter the Visualization Interface
In a Record, click Play or directly click the file to enter the visualization interface.
Basic Elements of the Visualization Interface
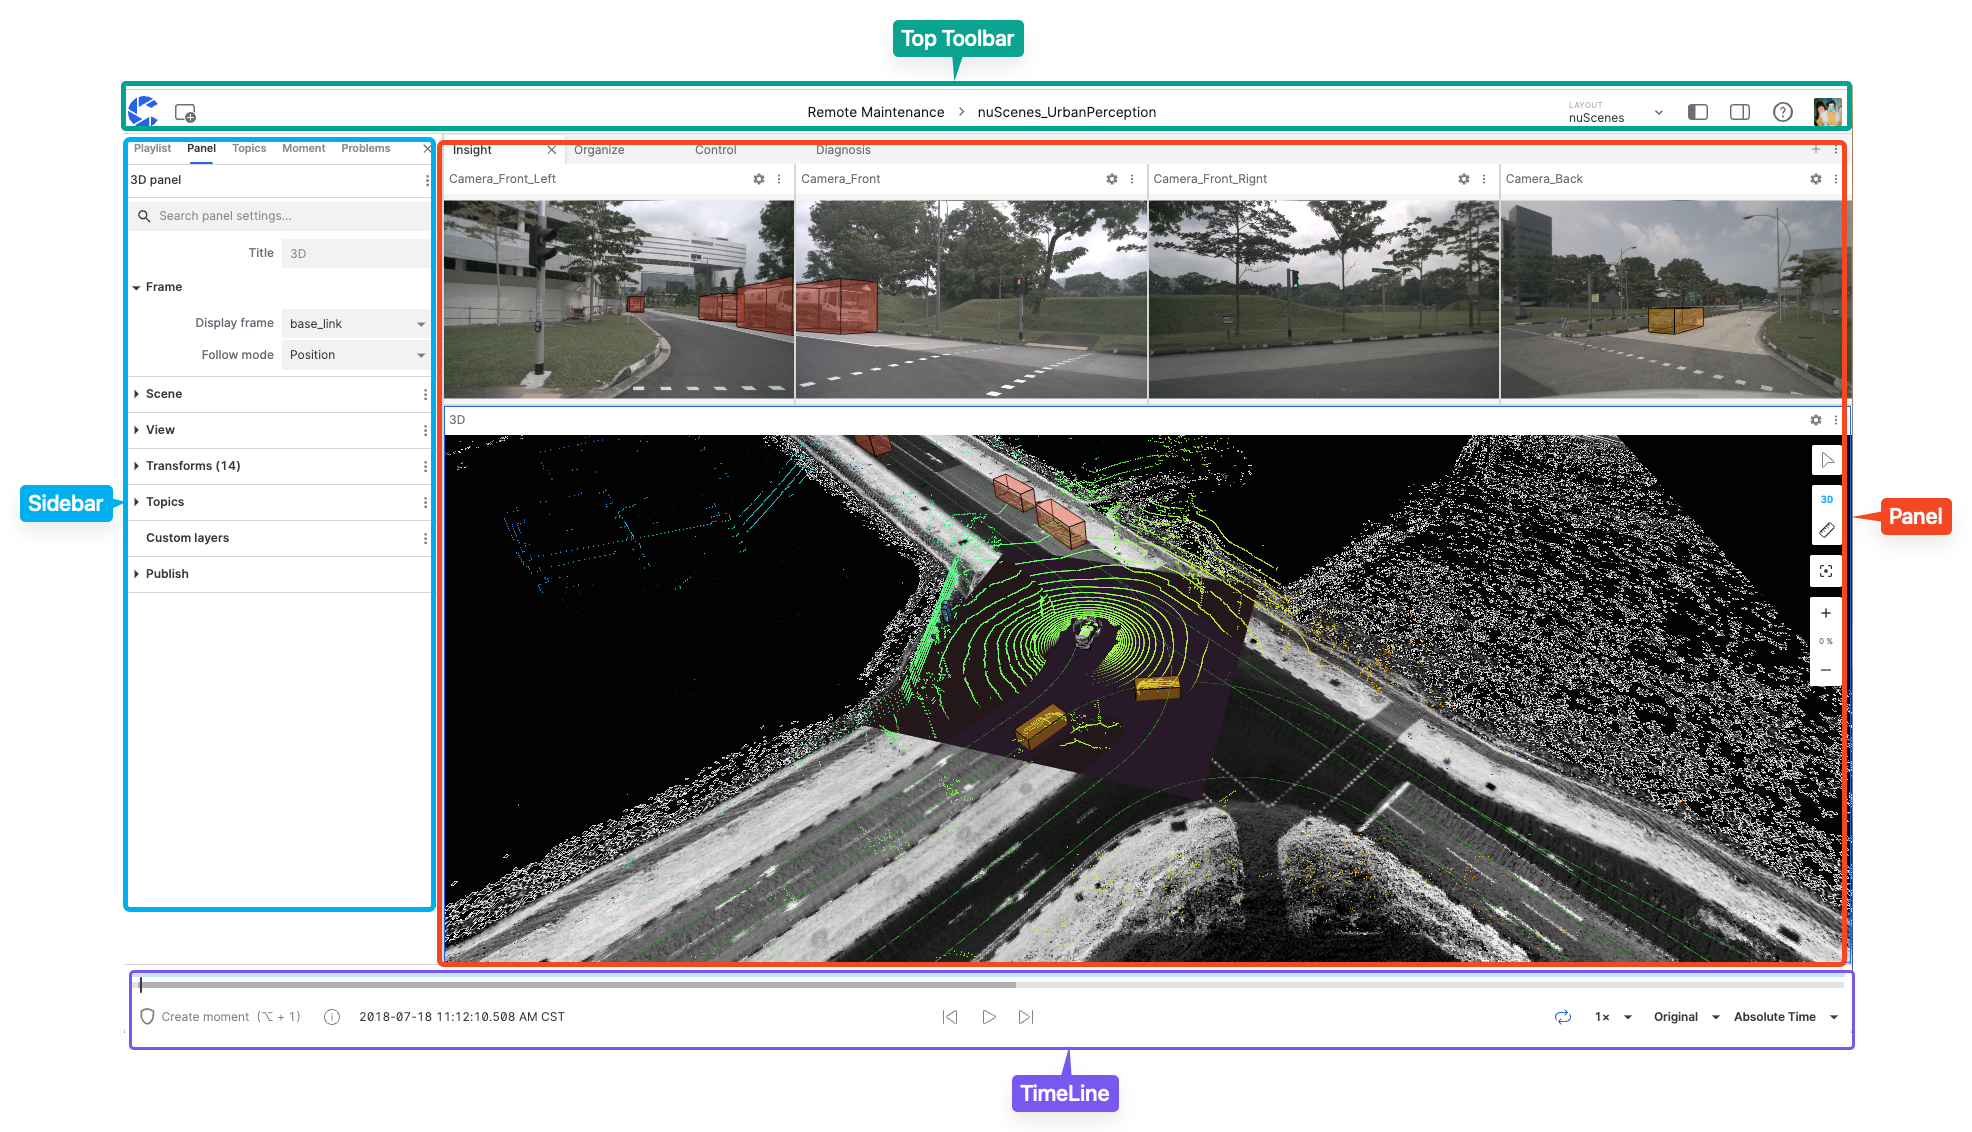
The basic elements of the visualization interface include the Top Toolbar, Panel, Sidebar, and Timeline.
Top Toolbar
The Top Toolbar is the area for navigation and access to various functions within the visualization interface.

The functions in this area include:
- Home Button
- Add Panel Button
- Project Name
- Record Name
- Layout Menu
- Collapse Left/Right Sidebar Buttons
- Help Documentation
- User Menu
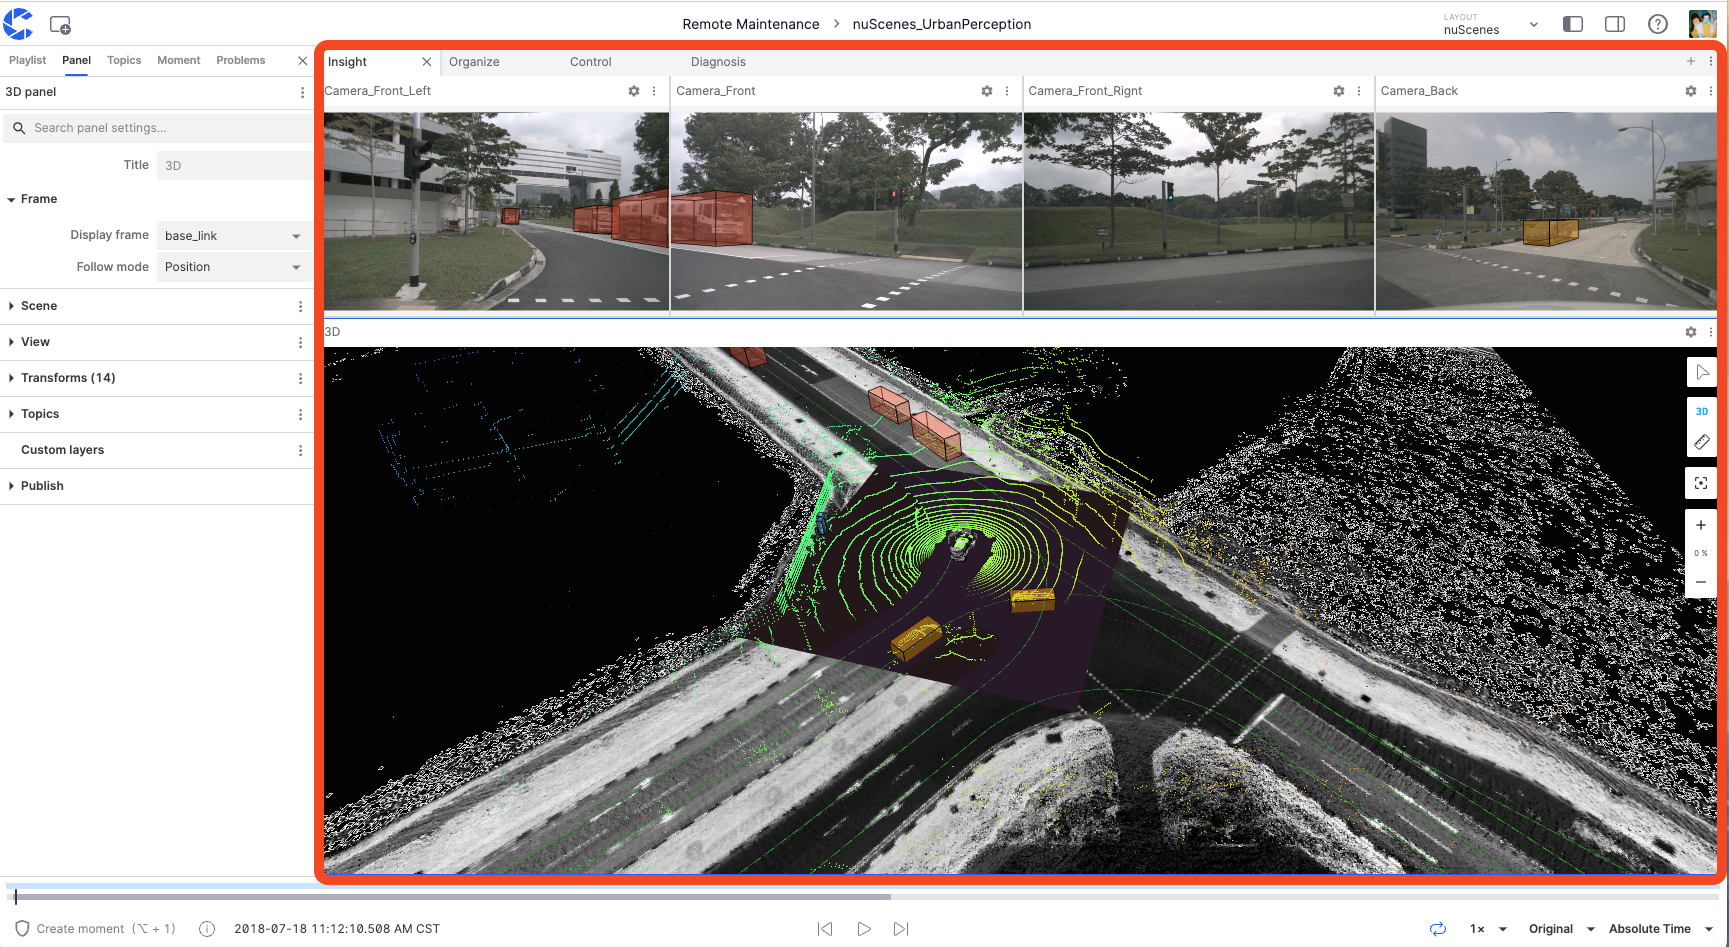
Panel
The "Panel" is a modular visualization interface that allows users to add, edit, and drag-and-drop different modules. It can be configured and arranged into personalized "layouts" to be shared with the organization and projects.
Sidebar
The "Sidebar" is the interface for configuring and managing different settings and information within the visualization interface, divided into "Left Sidebar" and "Right Sidebar."
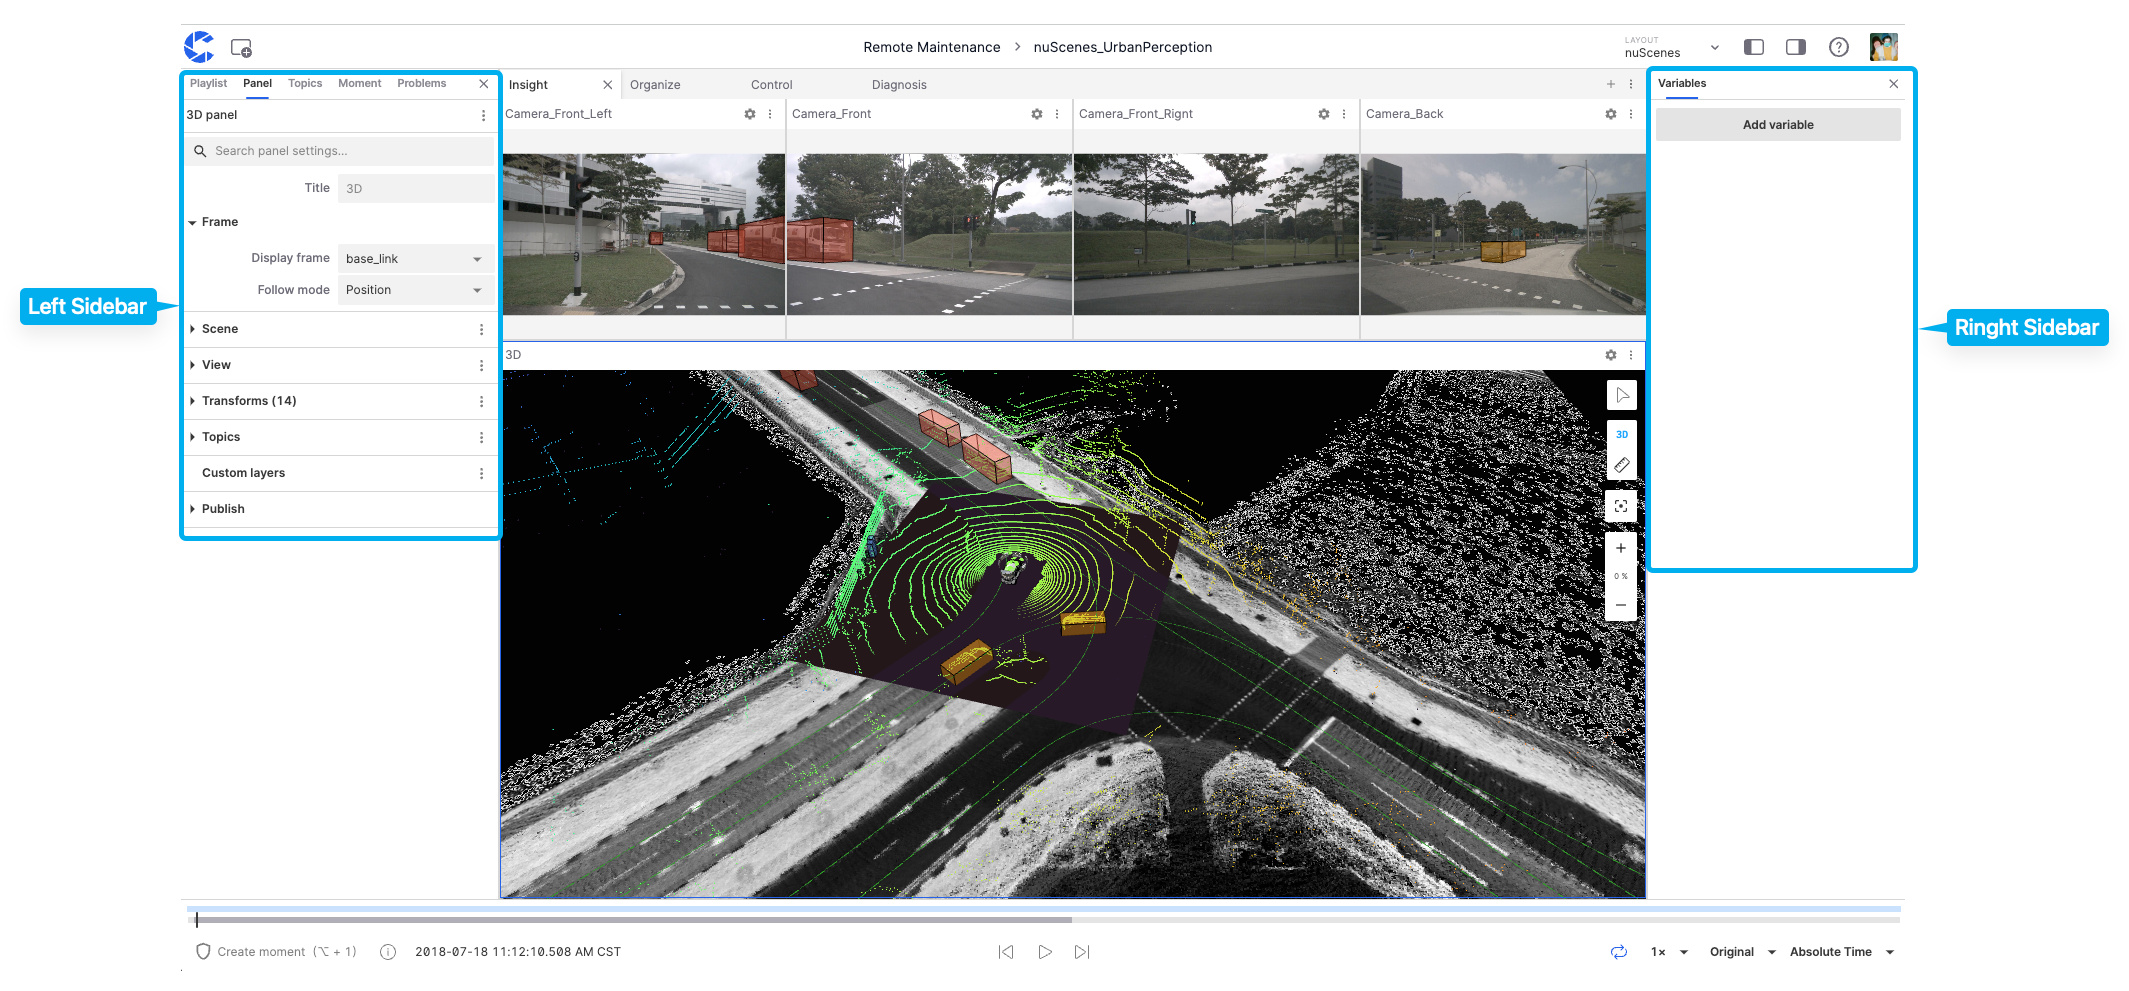
Left Sidebar
The "Left Sidebar" can display information such as Playlists, Panels, Themes, Moments, and Issues.
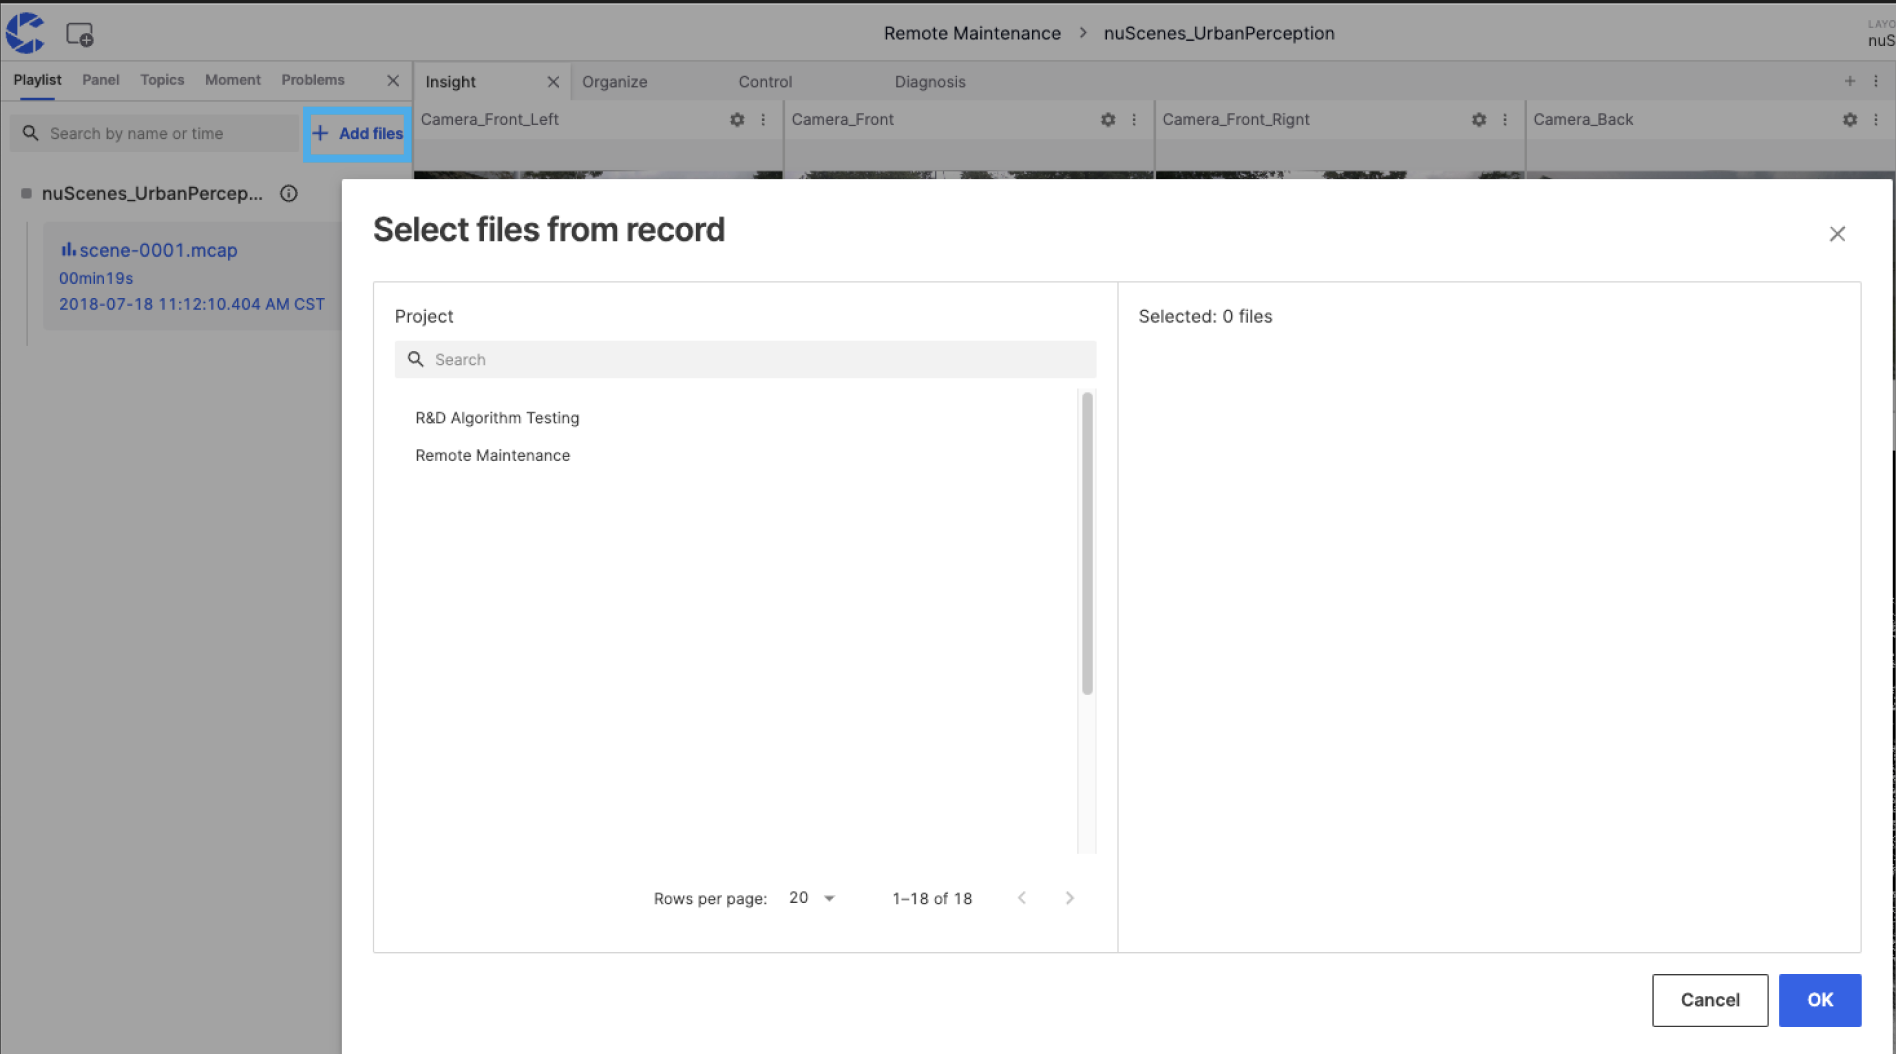
Playlists
The "Playlists" tool manages data files, supporting the sequential or on-demand playback of different files. The "Add File" option also supports adding Record files from different projects within the organization.
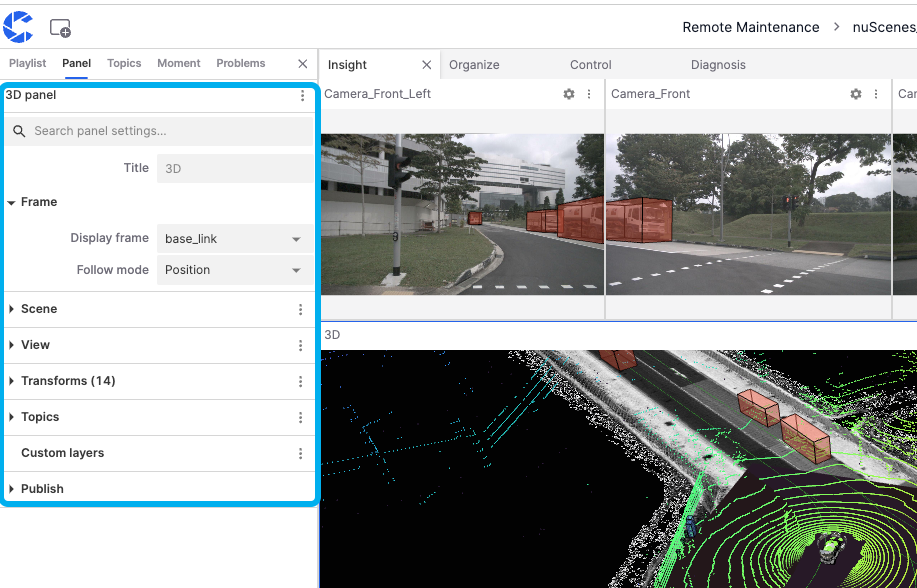
Panels
The Panels section allows viewing and changing the properties of the current panel. Users can switch between different types of "panels."
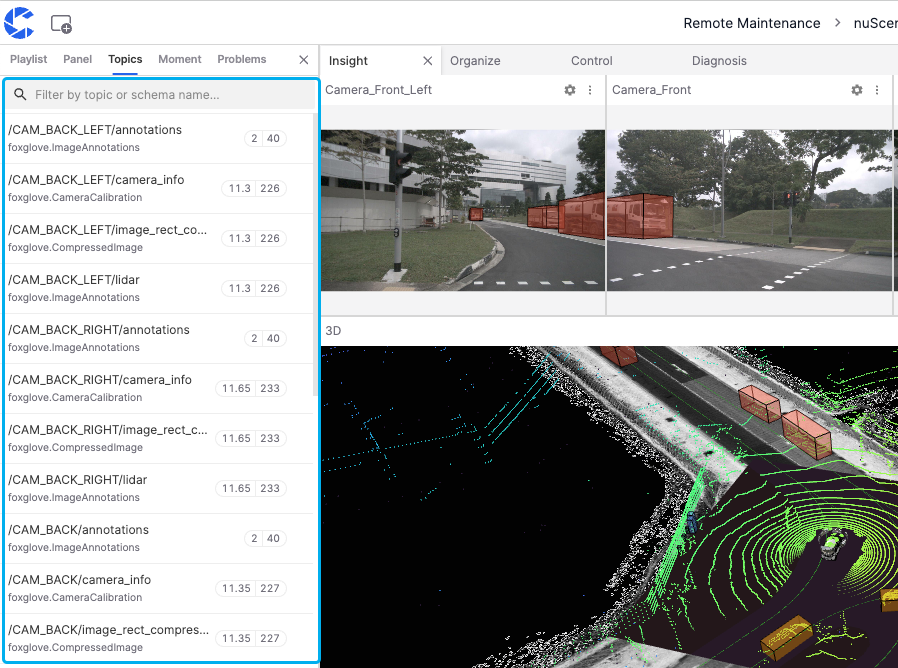
Themes
Themes refer to the categories or channels of data streams. Each theme represents a specific type of data source or sensor data, which users can filter in the search bar.
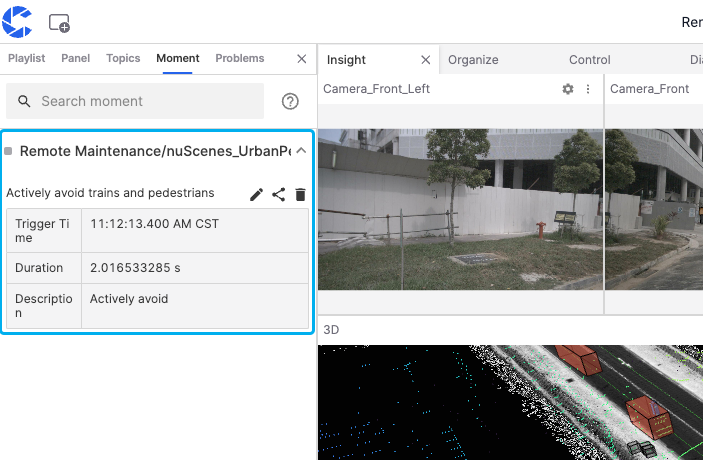
Moments
The Moments list allows users to display, edit, copy, and delete created moments.
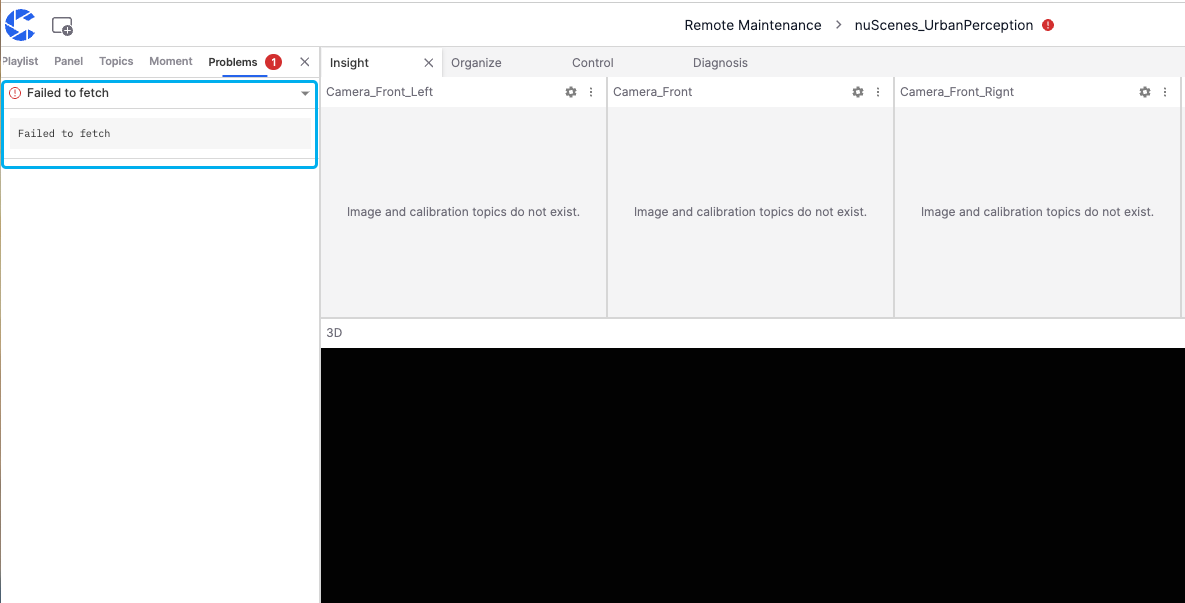
Issues
The Issues list shows specific error types when a fault occurs in the visualization interface. For example, "network error" appears in the image, causing the panel to fail to load.
Right Sidebar
The "Right Sidebar" in the visualization interface allows editing variable information.

Timeline
The "Timeline" is a tool for controlling and viewing the playback progress of visualizations, displaying precise timestamps of different moments.
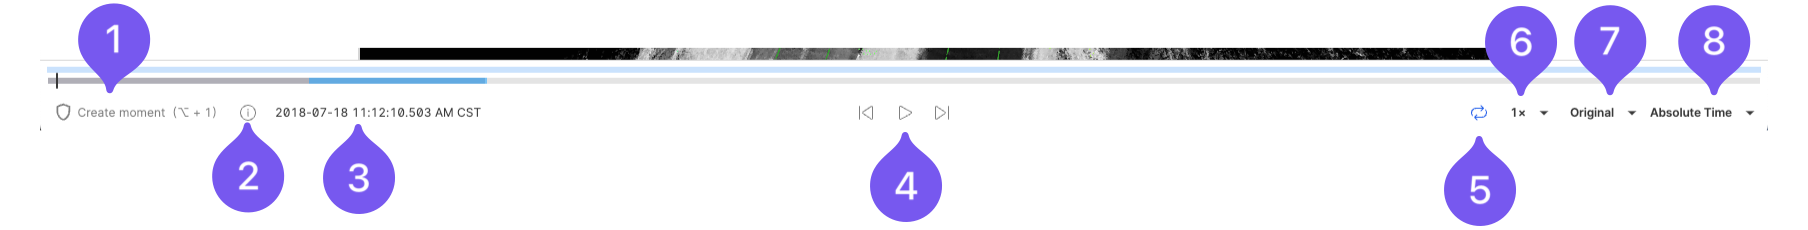
The functions in this area include:
- Create Moment button for selecting the start and end points of a "Moment"
- Display of the start time, end time, and duration of file playback
- Current progress timestamp
- Pause and forward/backward buttons
- Loop playback button
- Playback speed button
- Playback quality button
- Absolute/Relative time toggle button